


There’s more to sales enablement than just numbers, but a well-designed sales enablement strategy should have a measurable impact on sales results and revenue.
The challenge is identifying and tracking the right metrics.
This will have to be a collaborative, cross-functional effort with your organization’s Sales Ops team as well as frontline sales managers.
While seeing improvements in many of the listed metrics will be an indication that your sales enablement efforts are working, they’re also a testament to the work of each individual rep and all those in the sales org.
Here’s a quick overview of key actions you can take:
- Align the sales team’s performance expectations with stakeholders to choose the most meaningful sales performance metrics.
- Establish performance milestones (monthly, quarterly, biannually etc.) and clarify how you plan to measure and report progress against the metrics as time goes on.
- Make sure everyone, from senior leadership to managers and new hires, is on the same page regarding what metrics mean.
Don’t overwhelm yourself - it’s often wise to concentrate on a smaller number of metrics initially. You can track more later on as needed, but some enablement experts believe that just tracking four or five key metrics is enough.
On our Sales Enablement Innovation podcast, Senior Director of Revenue Enablement Gail Behun had this to say:
“I joke actually - I read an article years ago called ‘The 21 sales metrics you must be measuring now’ - and I thought ‘oh my gosh, for goodness sake, please no!’.
“I try to look at four or five at any given time consistently. I'd rather have fewer metrics that my team can look at and say: ‘This is what really matters”.

Sales productivity metrics
Before diving into specific measurements, let's clarify an important distinction. Sales enablement metrics are any data points you can track that relate to your enablement efforts. They're the raw numbers that tell you what's happening.
Sales enablement KPIs (key performance indicators), on the other hand, are the specific metrics you've chosen to measure progress toward your business goals. Think of metrics as all the ingredients in your pantry, while KPIs are the ones you've selected for tonight's recipe.
You'll want to track both leading and lagging indicators:
Leading indicators predict future performance. They're your early warning system, showing you what's likely to happen down the road. These include metrics like time to productivity, content usage rates, and number of sales activities.
Lagging indicators measure what's already happened. They're your report card, showing actual results like win rates, quota attainment, and revenue generated.
Here's the thing - you don't need to track everything. Focus on four or five key metrics that really matter to your team. It's better to have fewer metrics that everyone understands than a dashboard full of numbers nobody acts on.
Leading indicators are particularly valuable because they help you catch problems before they impact your bottom line. If a rep's call volume drops, you can intervene before it shows up as a missed quota.
Examples of leading indicators include:
- Time to productivity
- Available selling time
- Content usage
- Sales confidence
- Number of activities
- Sales stage conversion rate
Meanwhile, lagging indicators measure the outputs after the fact - the actual results.
For example:
- Win/close rates
- Quota attainment
- Customer churn rates
Some may argue that these are more sales enablement KPIs than sales enablement metrics, but enablement’s influence can be felt throughout the sales process so they’re worth keeping an eye on.
It’s important to remember that just looking at the more obvious, lagging indicators isn’t good enough because by the time you have that data, it’s too late to intervene and improve the numbers.
One example might be in relation to the number of activities a rep is performing. If a rep’s number of calls is way below average, you can spot that and address it before it manifests itself in the form of lower quota attainment.
Now we’re going to look at these leading and lagging indicators in a bit more detail before touching on the sales velocity metric.
 Ella Harrison
Leading indicators:
Time to productivity
The quicker you’re able to 'ramp up’ new reps, the sooner they’ll be contributing to revenue at their fullest potential.
Bringing new sales reps through your onboarding program and getting them ramped up right can lead to higher job satisfaction, lower turnover and higher performance.
Cutting down this ‘time to productivity’ is one of the primary metrics that can help prove the effectiveness of your training and coaching programs. Other angles you can take include examining 'time to first sale’, ‘time to second sale’, 'time to first meeting booked’, and so on.
These types of metrics will help guide your constantly evolving onboarding process. Decreasing ramp times for new employees indicate sales enablement efforts are improving.
Why this metric matters: The more effectively you onboard your new sales hires, the faster they will ramp; the faster they ramp, the sooner they start generating revenue at the level of your more tenured reps.
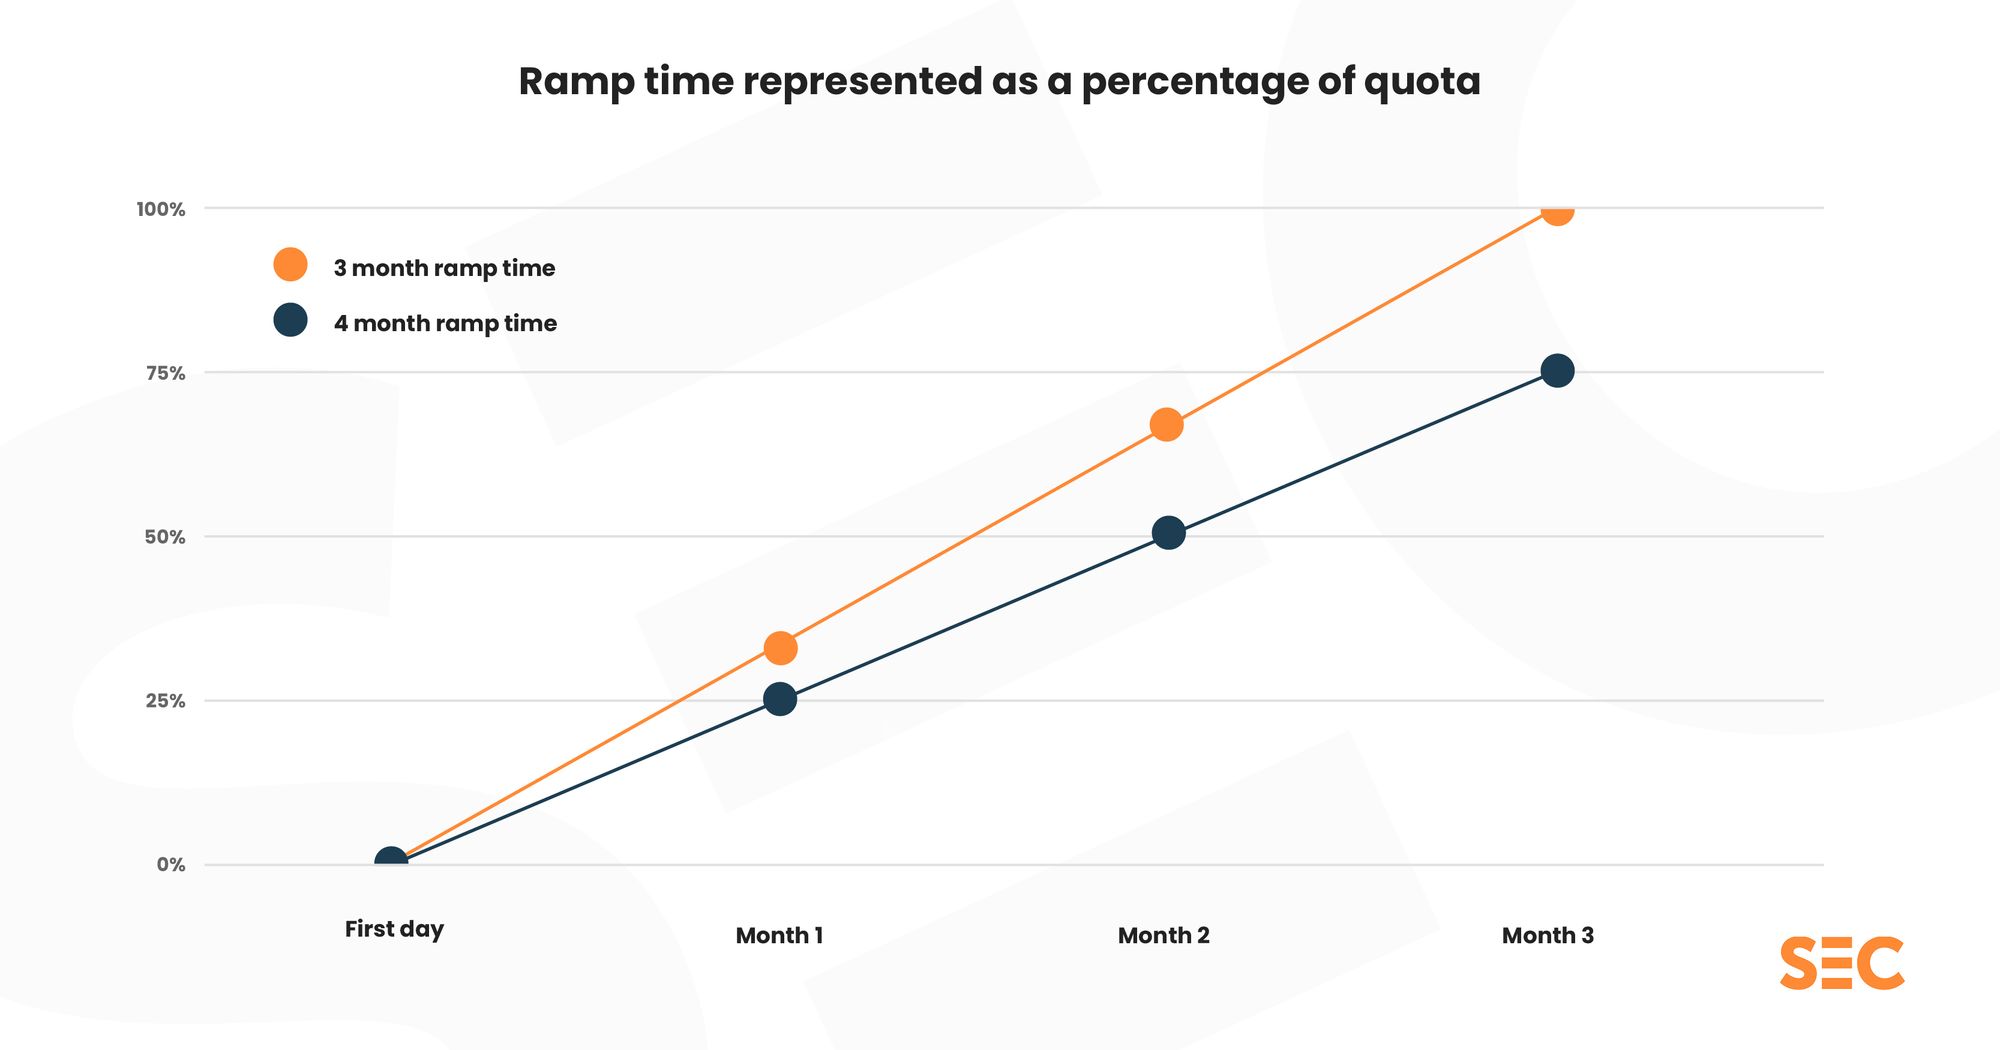
As you can see from this simple graph, the shorter ramp time (the orange line) generates more revenue for the sales organization faster.

Available selling time
Much of any organization’s sales strategy focuses on keeping sales reps on the phone and selling to prospects. The more time they spend on the phone selling to prospects, the more deals they’ll have a chance of closing.
The best enablement programs empower reps by providing all the tools they need to sell, when they need them.
Something that commonly eats into this selling time is having to spend time hunting around for sales content (think one-pagers, case studies, presentations, and training material).
A key focus for your sales enablement effort is to provide sales reps with all the tools and skills they need to sell - for example, saving their time by housing that content in one, highly-accessible place.
This can (and often is) achieved with the use of content management systems (CMS) and other sales enablement tools.
To measure available selling time, look at the percentage of each rep’s time spent on actual sales and attainment.
You could do this by:
- Monitoring the actual time sales reps spend on the phone each day, week or month.
- Using your CRM to track how many calls reps can get through in a set timeframe.
Why this metric matters: When you provide sales reps with the means to spend more time selling, with fewer interruptions, they’ll have a greater sense of focus on their main goal of increasing revenue.

Content usage and customization
Put simply, when you make content ridiculously easy to find, reps actually use it. Seismic’s 2022 Sales Enablement Forecast found that customers who streamlined access saw content usage jump 350 percent—evidence that accessibility turns reps into more active, better-equipped sellers.
But - there’s no point creating great, easily-accessible content if it doesn’t actually get used.
Looking at how often a sales rep opens, views or downloads a piece of content you’ve created is the obvious way to track its usage - the more views it gets, the more effective it’s being.
If your reps are regularly using your battlecard, for example, odds are it’s doing a good job. If on the other hand, no one’s touched your competitor comparison chart, that’s maybe a sign that they either don’t know how to use it or it hasn’t helped them when they have used it.
The former requires you to train reps on how to use that piece of content and why it’s useful, the latter however means you may need to consider redesigning that content.
Many of the aforementioned CMS and sales enablement tools can help track data such as views, as well as allow your reps to give your content a star rating (another way to measure its effectiveness).
As well as using these quantitative metrics, we’d also recommend pairing it with some hands-on qualitative research.
Ask your sales reps what makes those particular assets useful, which situations they use them in, what kind of responses they get from prospects when using them, and so on.
Why this metric matters: Content is a powerful tool for helping frontline salespeople engage with customers - but only if it’s relevant and actually useful. Identifying what is and what isn’t working allows you to fine-tune your content approach and maximize the return on the time spent creating it.
Sales confidence
A sales rep’s product knowledge alone isn’t enough to convince a prospective customer to buy your product.
Prospective customers need to sense self-assurance, so reps have to be able to speak with conviction, sincerity, and confidence in your product/service.
Measuring sales confidence isn’t difficult - simply survey your sales team and use the results to understand how prepared they feel when heading into a pitch.
Your survey doesn’t have to be complex, but make sure you ask the right questions, like:
- “How confident do you feel when pitching our product on a scale of 1-10?”
- “How equipped do you feel to beat the competition on a scale of 1-10?”
- “How would you rate the sale assets you have available to you on a scale of 1-10?”
Just remember not to launch your survey near the end of quarter - if everyone’s busy chasing quotas your participation rate will be lower than ideal.
Why this metric matters: Ultimately, your sales enablement strategy should equip reps with all the tools and support they need to feel self-assured and assertive when they pick up the phone, turn on their video or (when the opportunity allows) walk into a meeting.
Confidence isn’t soft fluff - it moves numbers! Companies with dynamic coaching programs (designed to build that confidence) record 28 percent higher win rates, according to CSO Insights’ Sales Coaching 101 eBook.

Number of activities
This metric isn’t complex, but it can be a reliable indicator for future performance. Essentially, it’s about tracking the number of relevant sales activities a rep performs. This is anything that’s part of the sales process and can lead to a closed deal.
Think:
- Number of calls made
- Number of emails sent
- Number of meetings booked
- Number of opportunities created
These numbers can provide many insights into your sales reps’ performance - and can be used in a predictive manner too.
For example, if a rep is creating a higher than average number of opportunities with a very low average number of calls, you might want to investigate that as it’s likely not sustainable.
Likewise, if you spot a rep who is booking a low number of meetings while also having a low number of calls made, you can take action.
Why this metric matters: Sales is a numbers game, so it’s important to keep an eye on these activity metrics and use them alongside other data points to get a clearer view of your sales team’s performance over a period of time.
Sales stage conversion rate
This can be a really important metric in determining why a sales rep or team is underperforming, as it shows you exactly at which stage of the sales process your team is hitting snags and losing potential deals.
It’s a simple calculation but it does involve tracking multiple stages. Here’s our example for a four-part sales process:
If you have 50 opportunities that make it to your first stage, and 25 of them progress to stage two, your stage one to stage two conversion rate is 50%. (25/50)
Then, if eight of those 25 progress from stage two to three, your conversion rate for that part of the process is 32%. (8/25)
Repeat this for each set of stages in your process and you’ll soon have a clear view of how deals progress among your reps.
The amount of stages in a sales process and the names of said stages will vary, so make sure to be flexible with the example and adjust it accordingly.
Why this metric matters: This metric allows you to pinpoint where your sales team’s strengths and weaknesses lie. If, team-wide, the conversion rate from stage one to two is high, but it falters at moving deals from stage three to four, you know where to focus your training and coaching efforts.
Additionally, if the majority of your team is great at moving deals from stage two to stage three except a couple of reps, you know where to focus potential personalized training for them - maybe even involving mentorship from reps who perform well at this part of the sales process.
Lagging indicators
While leading indicators help you predict the future, lagging indicators tell you how you actually performed. They're the final score, showing whether your enablement efforts translated into real business results.
These metrics arrive after the fact, so you can't change them. But they're crucial for proving enablement's impact and identifying what strategies to double down on.
Win/close rates
Your win rate reveals how effectively your team converts opportunities into customers. There are two ways to calculate it:
Example: 5 wins from 20 opportunities = 25% win rate
Example: $75,000 won from $500,000 in opportunities = 15% win rate
The revenue method often shows a lower percentage but gives you a clearer picture of dollar impact. Track both for the full story.
There are obviously a lot of factors that can affect win/close rates, and with it being a lagging indicator there's nothing you can do to "fix" the number before it's too late - the deal's already been won (or lost).
However, you can use the figures to estimate the overall effect your enablement has been having. Have win/close ratios improved in the quarter following your training revamp, for example?
Why this metric matters: This lead-to-conversion measurement is important for sales enablement to keep an eye on as positive trends can indirectly indicate that your sales enablement efforts are having the desired impact.
Don’t focus solely on this data point, but use it in combination with other metrics to get a clearer picture of your sales team’s performance.
Quota attainment
This classic metric shows what percentage of your team hit their targets. If 65 of 100 reps reached quota, that's 65% attainment.
But dig deeper. Track how reps missed or exceeded quota:
- Within 5% of quota
- Missed by 5-10%
- Missed by more than 10%
- Exceeded by more than 10%
This breakdown reveals whether you have a widespread problem or just a few struggling reps.
Why this metric matters: Quota attainment directly reflects your team's ability to generate expected revenue. It's often the first metric executives examine.

Customer churn rate
This one is relevant to any enablement professionals who work on enabling their customer success (CS) teams, though alignment between sales and CS can influence this metric.
If you enable customer success teams, churn rate becomes your report card. Calculate it with:
Example: Started with 1,000 customers, ended with 800 = 20% churn
High churn might indicate poor expectation setting during sales, inadequate onboarding, or gaps in ongoing support.
Why this metric matters: Keeping existing customers costs far less than acquiring new ones. Reducing churn by even a few percentage points significantly impacts revenue.
Sales velocity
Sales velocity has become the Swiss Army knife of enablement metrics. It combines multiple data points into one number that shows how fast you're generating revenue.
Understanding the formula
Here's how to calculate sales velocity:
(Number of Opportunities × Average Deal Value × Win Rate) ÷ Sales Cycle Length
Let's break down each component:
- Number of opportunities: Total qualified opportunities in your pipeline
- Average deal value: Mean contract value of closed deals
- Win rate: Percentage of opportunities that become customers
- Sales cycle length: Average days from first contact to close
Example calculation:
- 100 opportunities
- $10,000 average deal value
- 25% win rate
- 30-day sales cycle
Sales velocity = (100 × $10,000 × 0.25) ÷ 30 = $8,333 per day
This means you're generating $8,333 in revenue per day through your sales process.
Using sales velocity strategically
The real power of sales velocity comes from understanding which lever to pull. Each component offers a different path to improvement:
Increase opportunities: Better prospecting, improved marketing alignment
Boost deal size: Upselling, cross-selling, targeting larger accounts
Improve win rate: Better qualification, enhanced sales skills
Shorten cycle length: Streamline process, remove bottlenecks
As Christi Loucks noted at our Sales Enablement Festival:
A seller may have a high sales velocity score, but it might be due to one extreme metric. It's important to understand why their score is that high.
Watch for imbalances. A rep with amazing velocity due solely to huge deal sizes might struggle when those big deals dry up. Sustainable performance comes from balance across all four components.
Why this metric matters: Sales velocity gives you a single number to track improvement over time while showing exactly where to focus your enablement efforts.
Christi Loucks
Measuring sales enablement ROI
Proving ROI might be the most important metric you track. It's how you justify your budget, secure resources, and show leadership that enablement isn't just a nice-to-have.
Calculating enablement ROI
The basic sales enablement ROI formula is:
ROI = ((Gain from Investment - Cost of Investment) ÷ Cost of Investment) × 100
For sales enablement, this might look like:
- Gain: Increased revenue from improved win rates, shorter sales cycles, or faster ramp times
- Cost: Salaries, tools, content creation, training programs
Example calculation:
- Enablement reduced ramp time by 30 days across 20 new hires
- Each rep generates $10,000/month when fully productive
- Gain: 20 reps × $10,000 × 1 month = $200,000
- Cost of enablement program: $50,000
- ROI = (($200,000 - $50,000) ÷ $50,000) × 100 = 300%
Presenting ROI to leadership
Numbers tell, but stories sell. When presenting your return on investment:
- Lead with the headline: "Our enablement program delivered 300% ROI in six months"
- Show the math: Walk through your calculation simply
- Highlight multiple wins: Revenue gains, time savings, improved retention
- Project future impact: "If we maintain this trajectory..."
Remember to track both quantifiable returns (revenue, time saved) and qualitative benefits (improved morale, better customer experience). Leadership cares about both.
Why this metric matters: ROI is the universal language of business. When you can measure sales enablement success through positive returns, you transform from a cost center to a profit driver.

What to do with the insights
Data on its own is just numbers, but those numbers tell stories about your sales reps, your sales team, and your sales enablement initiatives.
You need to feed the stories these metrics tell you back into your ongoing enablement plans and make appropriate adjustments based on the evidence you have - this is especially important with leading indicators as you can get ahead of issues before they become more problematic.
If your data is showing that your new reps’ time to productivity is too long, it may be a signal that it’s time to revisit your onboarding program.
Are certain reps not creating enough opportunities because they’re not making enough calls? You can intervene before it affects lagging indicators like quota attainment.
Culture matters. The 2025 Impact of Enablement Report shows that 38.7 percent of enablers still don’t have full senior-leadership buy-in, and that gap drags down performance expectations—proof that transparent, well-supported teams simply execute better.
Make sure you are facilitating employee connections, reinforcing your culture, and pairing the new hires with mentors who they can approach for advice.
When you combine thoughtful conversation with accurate data about their work, it shows sales reps that you care about helping them succeed, and that's the most rewarding part of the sales enablement role.
Ready to master sales enablement metrics?
You have learned what to measure, now the next step is to prove it.
Enablement Metrics Certified: Masters gives you the skills and frameworks to make your impact undeniable:
✅ A metric mindset that sticks — Understand not just what to measure, but why it matters and how to connect it to business outcomes
✅ Practical measurement methods — Learn how to identify the right metrics for programs like onboarding, product training, and more
✅ Reporting that resonates — Master the art of presenting data to cross-functional teams and leadership in a way that drives decisions
✅ Real-world examples — See how experienced enablement professionals measure and communicate their value
✅ Official certification — Add a credential that signals you're serious about proving enablement's place at the table
Get Enablement Metrics Certified →
10 modules. 3 hours. Lifetime access. One-time investment.


Sales enablement insider
Thank you for subscribing
Level up your sales enablement career & network with sales enablement experts
An email has been successfully sent to confirm your subscription.
 Follow us on LinkedIn
Sales enablement insider
Thank you for subscribing
Level up your sales enablement career & network with sales enablement experts
An email has been successfully sent to confirm your subscription.


.svg)