

Guy gave this presentation at the Chief Revenue Officer Summit in London in December 2022. Get the highlights of the full event and more with an SEC membership.
My name is Guy Rubin, CEO of Ebsta. I was asked to pick a topic, and I wanted to find something that was going to be engaging and useful for the community.
We're all being asked to do more with less - that’s the kind of message I'm hearing out there consistently.
So, as the market around us is changing, what are we going to do in order to continue to win? Because that's what we're here for, right? We all get paid danger money because we're in the business of winning.
So:
- How are we going to win?
- What can we do to ensure that we've got a more predictable revenue engine as the market changes around us?
We've recently launched a benchmark report, which has some really interesting insights in it and I thought it'd be useful to bring some of these insights to the table in this article.
We analyzed 1.6 million opportunities across $100 billion worth of revenue across our client base, and produced a report. But before we jump into the insights that we found in this report, I want to set the scene.
I’ll be talking about:
- The sales landscape
- The fundamentals of digital sales teams
- Driving exponential results
- The secrets behind predictable revenue growth
Let’s dive in. 👇
The sales landscape
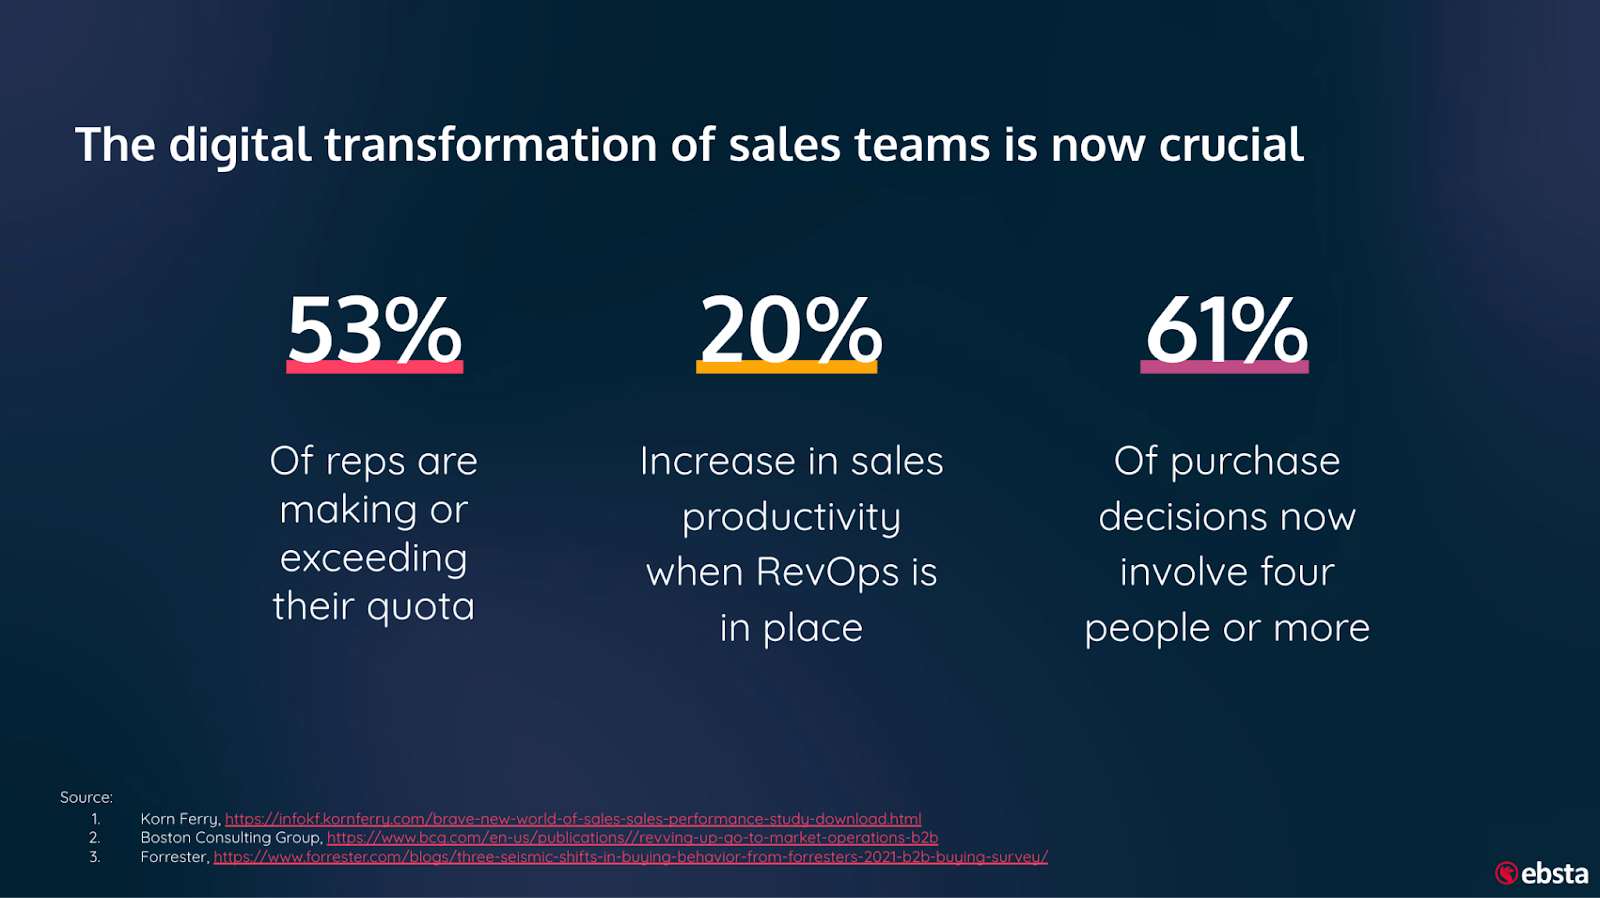
We're seeing that only half of reps are consistently hitting quota. That's a huge stat because we're all employing salespeople, and if they're not hitting quota? Well, we've got a problem.
The other issue we're seeing consistently is that more and more deals need more and more stakeholders involved - we're getting very close to that point of decision by committee. That's causing every sales process to become more complex.
There's more hurdles to jump over - getting to somebody within an organization that has the budget to buy your product is only one stage. That in itself is becoming more complex as we move forward.
Now there is a light at the end of the tunnel, it's the middle stat in the image.
We're seeing consistently now that RevOps is having a massive impact on a company's ability to scale and become more predictable in the way that they grow their revenue engines.
I spend a lot of time in North America, and what's fascinating is that this is not a debate there anymore. We still have conversations in the UK with businesses that don't necessarily recognise that they need to be more data driven in the way they run their sales teams.
They don't recognise the need for consistency.
In America, that debate has happened and passed, and people are all talking about RevOps - and RevOps is getting more investment.
I thought those are some useful points to highlight before diving in.
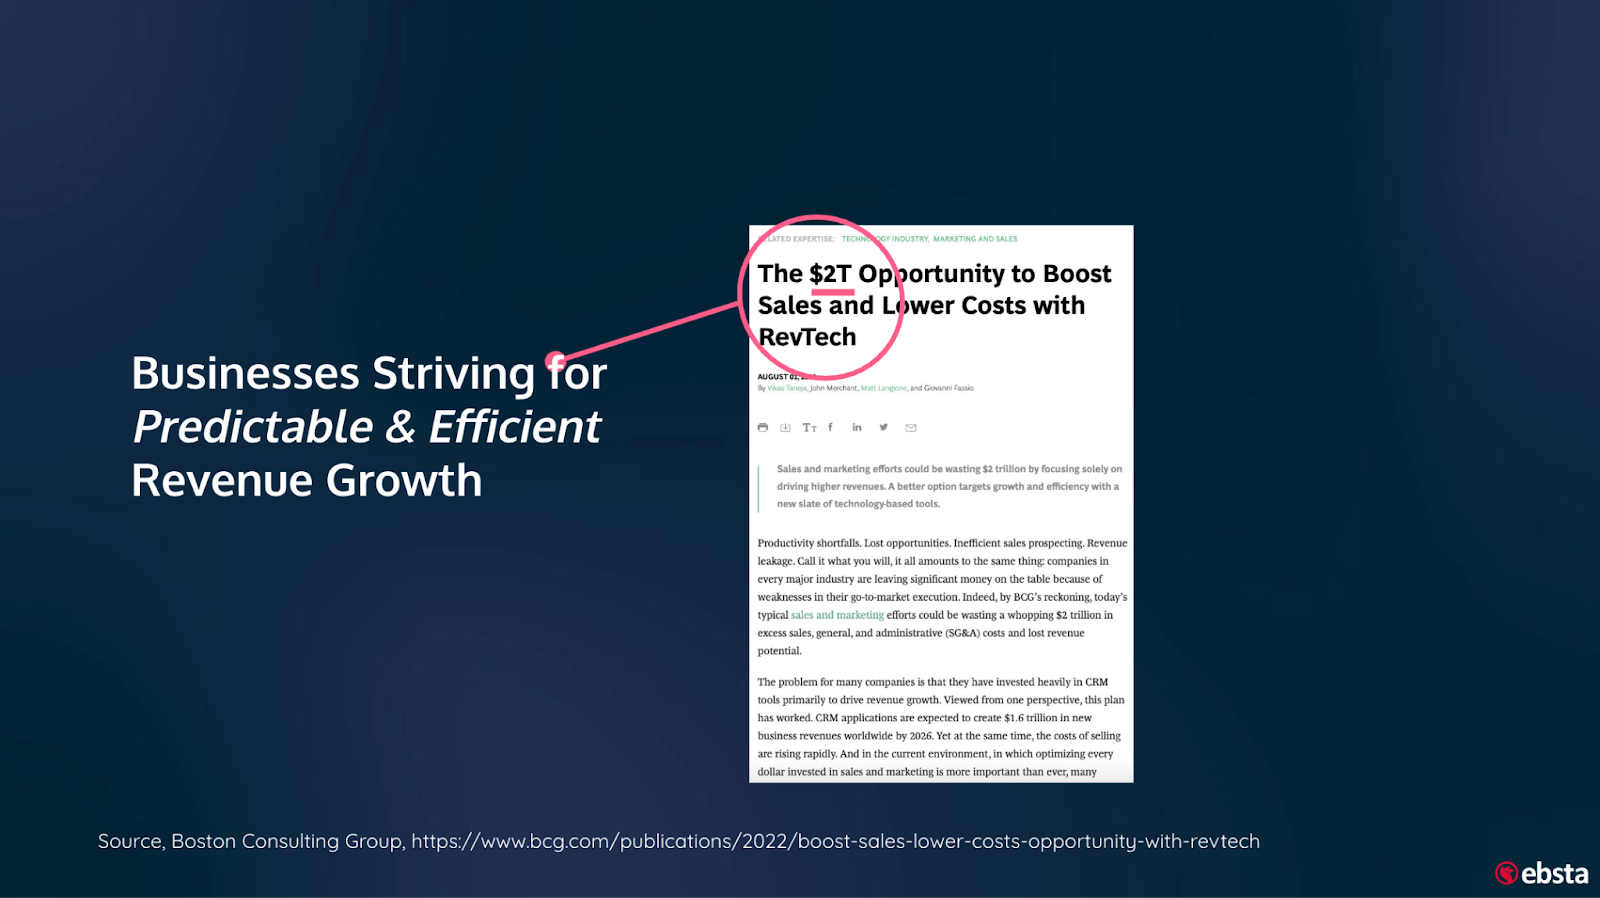
The only other source I'm going to touch on today before we go into the data, is this report here by Boston Consulting.
The inefficiencies within sales are huge.
In the report, one of the most interesting stats was that only 30% of opportunities opened close won. And in addition to that, the deals that close loss spend twice as long in the pipe as deals that are close won.
There are huge inefficiencies in the sales process, and I would encourage you all to have a read of this report by Boston Consulting because it really is game changing. It really helps to reset the mind and highlight the opportunity in front of us all.
The fundamentals of digital sales teams
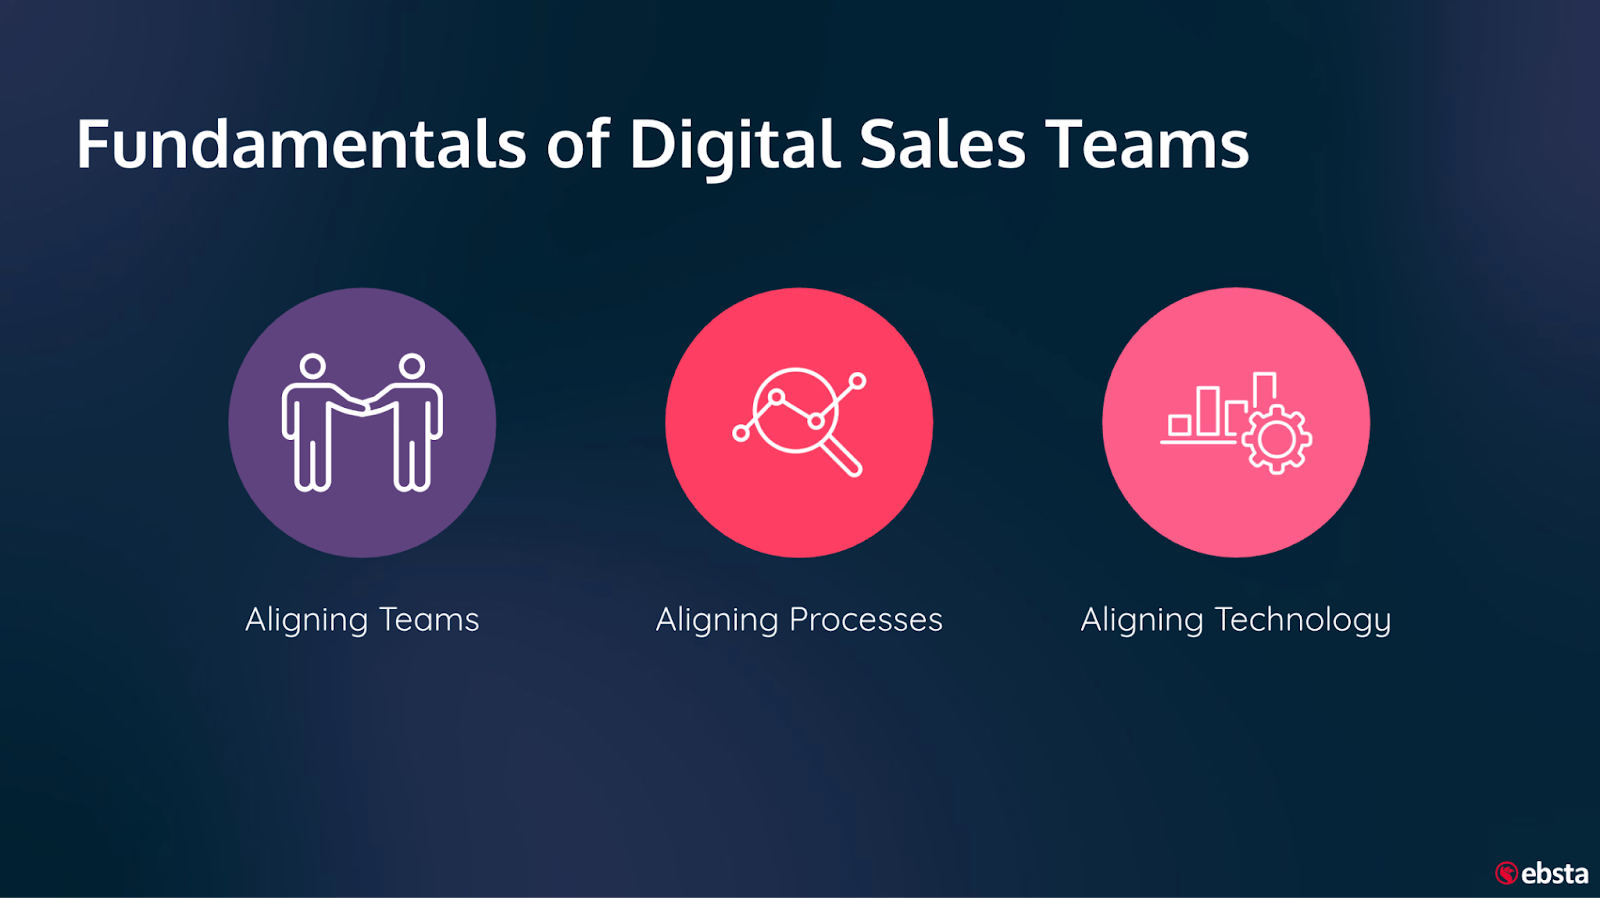
So what are the fundamentals of RevOps? What does it mean when we hear this term RevOps a lot?
Is it just another sales happening? What does that actually mean to the business?
I think that really this is all about aligning all of the teams towards a common goal - and that common goal should be revenue.
It sounds obvious, but you'd be shocked and surprised by how often we find that's not a consistent common goal.
Aligning the different departments with the technology and the processes is vital, because the customer doesn't care which department is looking after them.
They don't care that they're in a marketing cycle or that they're in a sales process or they're being looked after by customer success. What they want is a consistent process across the board.
While most businesses will buy into that, what we find consistently across the larger organizations is that you've got different departments running things in very different ways.
You get different egos responsible for different geographies, deciding to run their sales function in a very different way to someone else's and the problem with that approach is it doesn't give you that consistency.
It doesn't allow you to learn fast, and there’s inefficiency in people doing things a different way.
It's okay if we don't get it right the first time. But if everybody is doing it slightly differently, it becomes very difficult to work out what works, and then replicate and scale that.
So, aligning the teams to revenue and having consistency is the key takeaway from this article.
Driving a consistent approach across the organization is going to give you that ability to learn what works, and allow you to run those experiments.
Not every marketing campaign is going to give you the best results, not every sales process is going to be perfect. But if we do things in a consistent way we can learn from it much quicker.
Driving exponential results
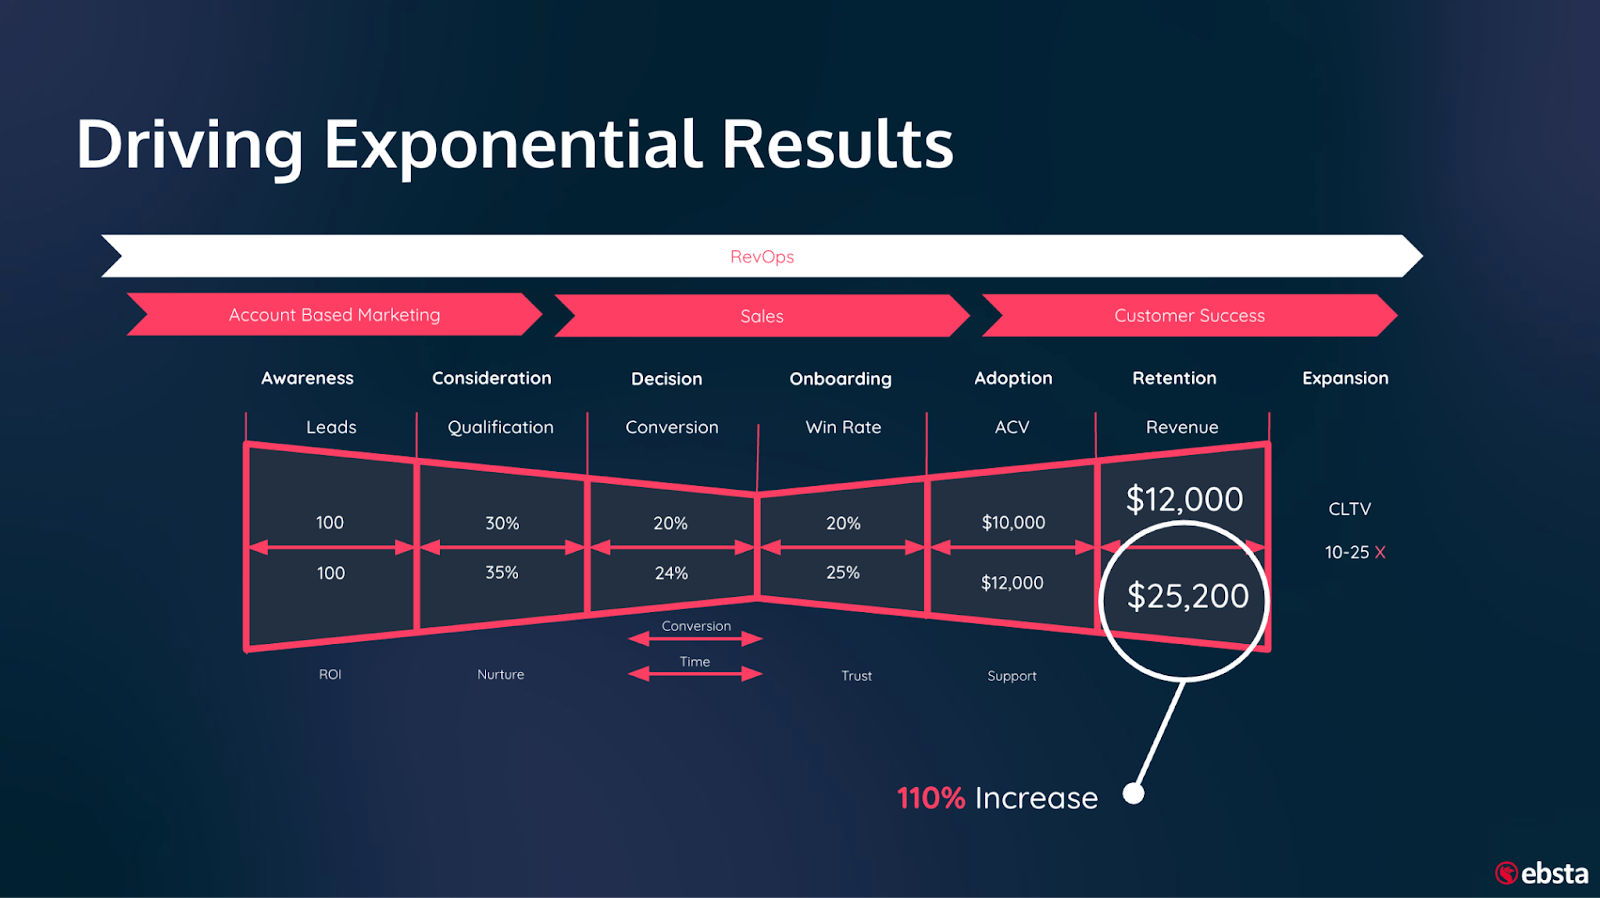
This image here is one of my favorite graphics, especially in today's market, because what it does is it highlights the impact and value of RevOps on an organization.
The beauty of RevOps is that it's not about spending more money, and it's not about having more leads at the top of the funnel. We don't need more leads, what we need is to slightly improve the conversion stages across the customer lifecycle.
What we can see from this graphic is that those small incremental improvements can have exponential results. And RevOps, unfortunately, is just like going to the gym. You can't just go two or three times.
It's that constant improvement, those small incremental improvements across the customer lifecycle that will achieve exponential results.
Measuring this data, which is coming back to the previous image, involves having everyone doing it in the same way so that you can learn quicker. That way, those experiments can run and you can make changes as required.
Having a consistent approach allows you to run it like a science project.
The secrets behind predictable revenue growth
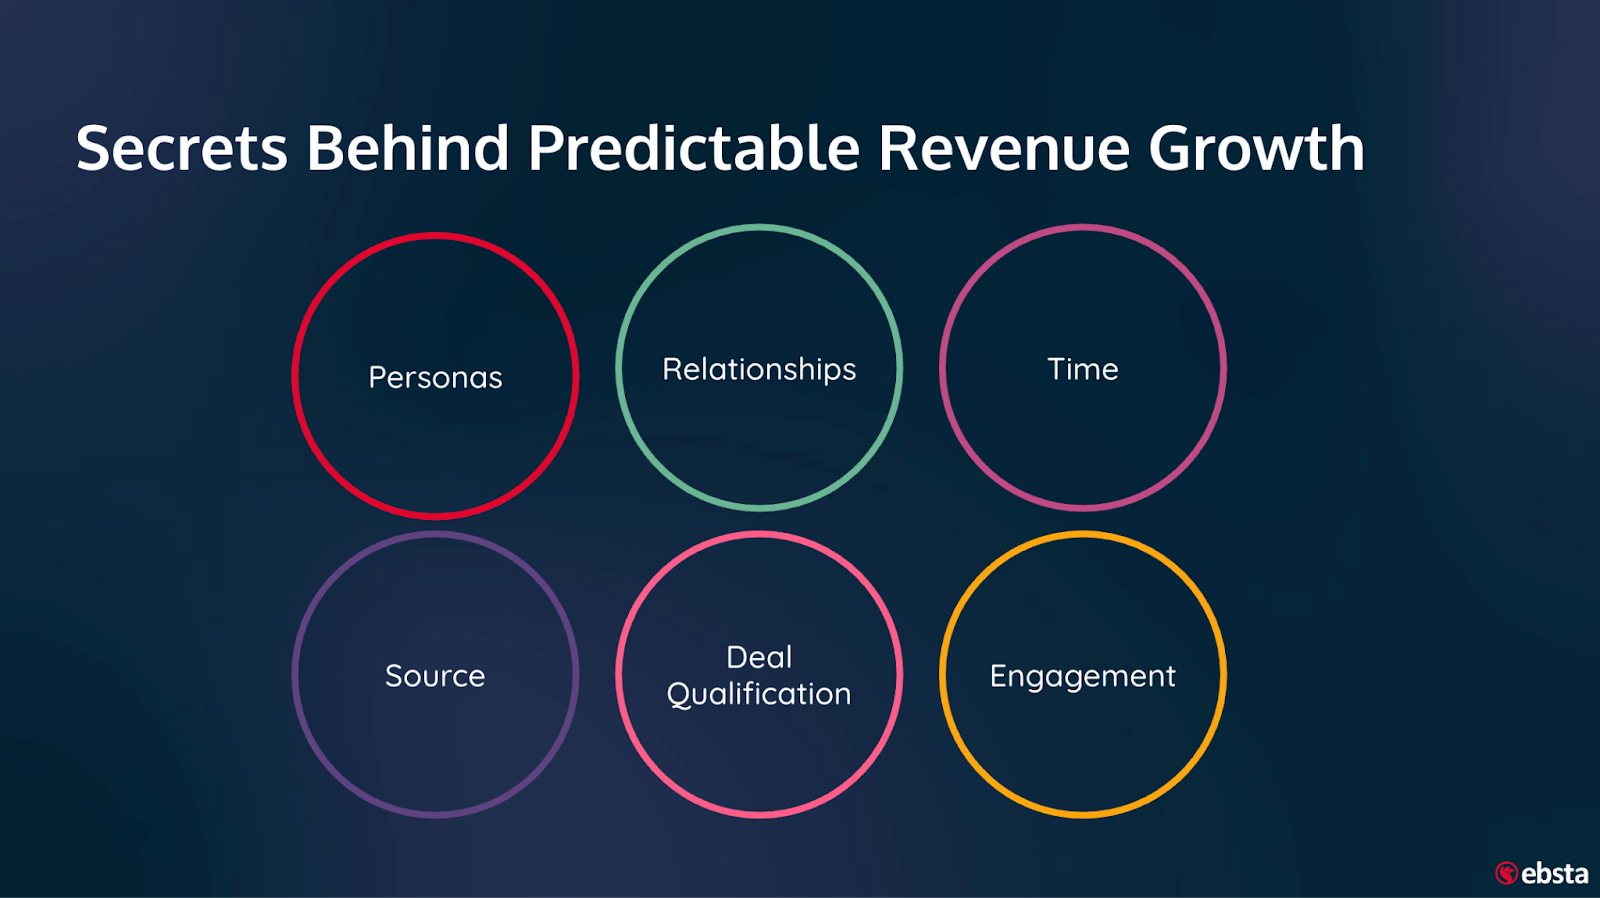
Let's get into the data. There's all sorts of signals that customers have around their revenue engine, but these are the six that we found had the biggest impact on revenue, so I'm going to touch on these six and show you the insights that we've gleaned from the report we generated.
One of the things we do with our customers when we onboard them is look at the last 12 months worth of deals that they've been running, to try and understand which personas gave them the best conversion rates at each stage of the sales cycle.
By analyzing all the engagement activity that took place, and we don't rely on what the users put into Salesforce, by the way, we find the data from its source by having access to your mail service. That way we can see every meeting that ever took place.
How often have we seen deals that were open on one day and closed the next? Well, we know that the sales cycle actually took three months.
The activity in the mail server will tell us when the first meeting was, it will tell us how often you engaged with different stakeholders at each stage of the sales cycle.
Personas
By understanding that, you can see who your champions are at different stages and you'd be surprised by how often it's not the economic buyer in particular that you should be engaging with stage one.
Getting that champion can introduce you to the economic buyer with a credible introduction, and is actually an easier way (more often than not) to get through a sales cycle.
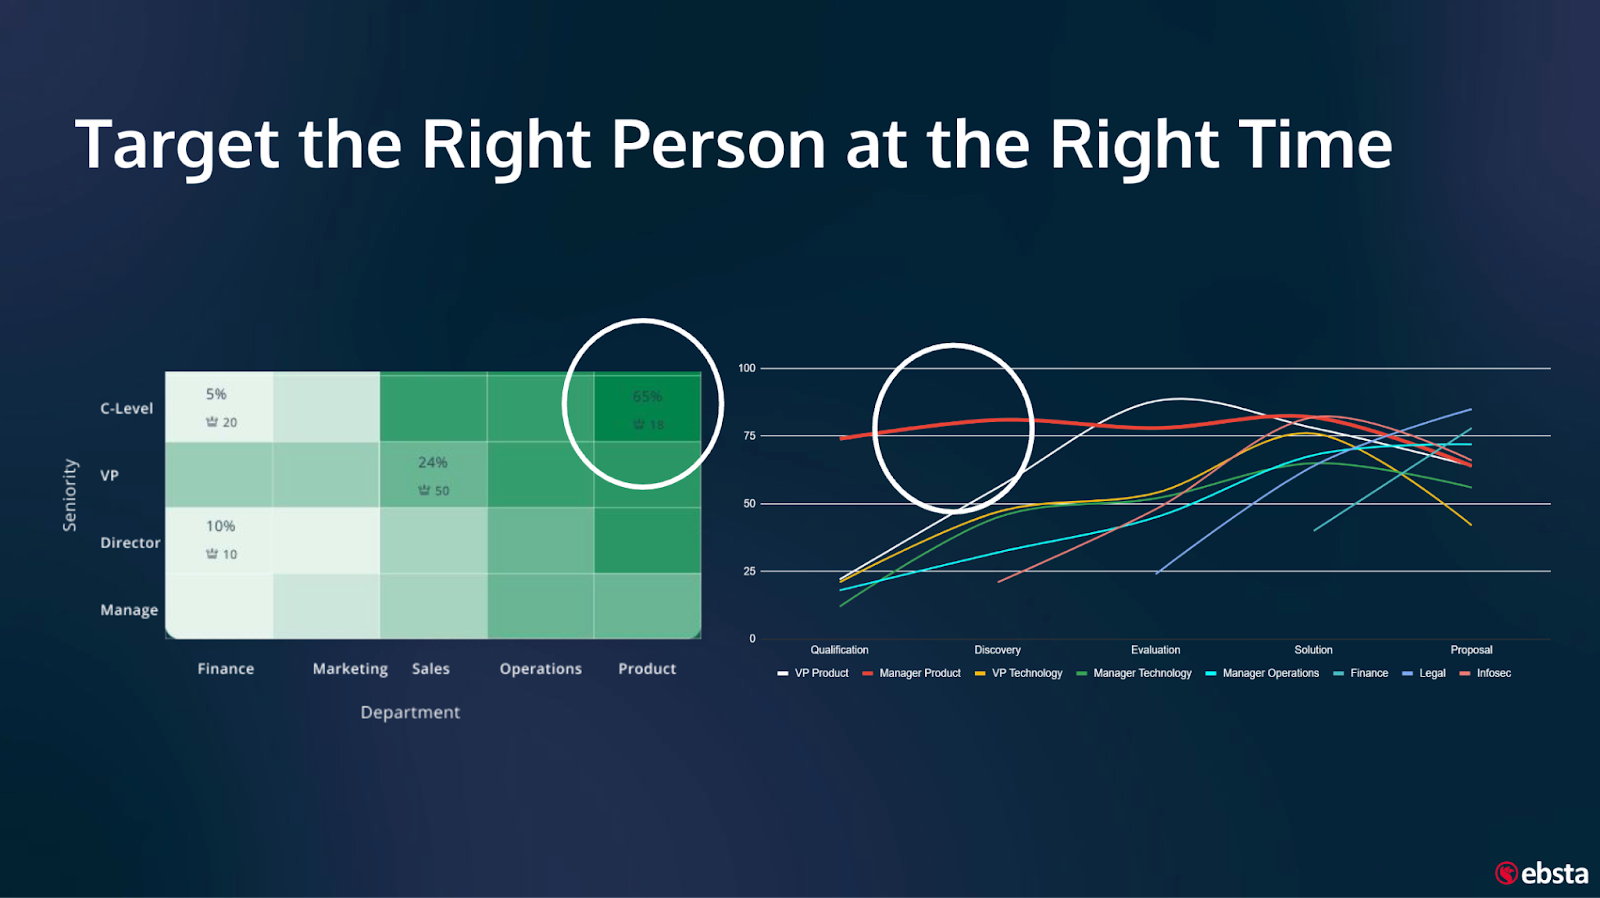
You're going to have to get the CFO involved at some stage, but there's no point engaging with them in stage one or two, if actually, all you need them for is to review the contracts.
The beauty is that the data already exists within your organization.
By looking at every deal you close won or lost over the last year, you're able to understand the momentum you have with different stakeholders and what achieved what outcome (and how), what was the optimal engagement required with different stakeholders to achieve the outcome you're aiming for.
The next step is really interesting, and again, different organizations will work in different ways, but it involves looking at how multi-threaded you were on different deals in the past and the influence of that multi-threading on win rates.
Yes, we do see deals come in where you've got just one person engaged, maybe it was somebody you worked with in a previous business and the deal was “send me an invoice because I want to buy again” - that's great.
Relationships
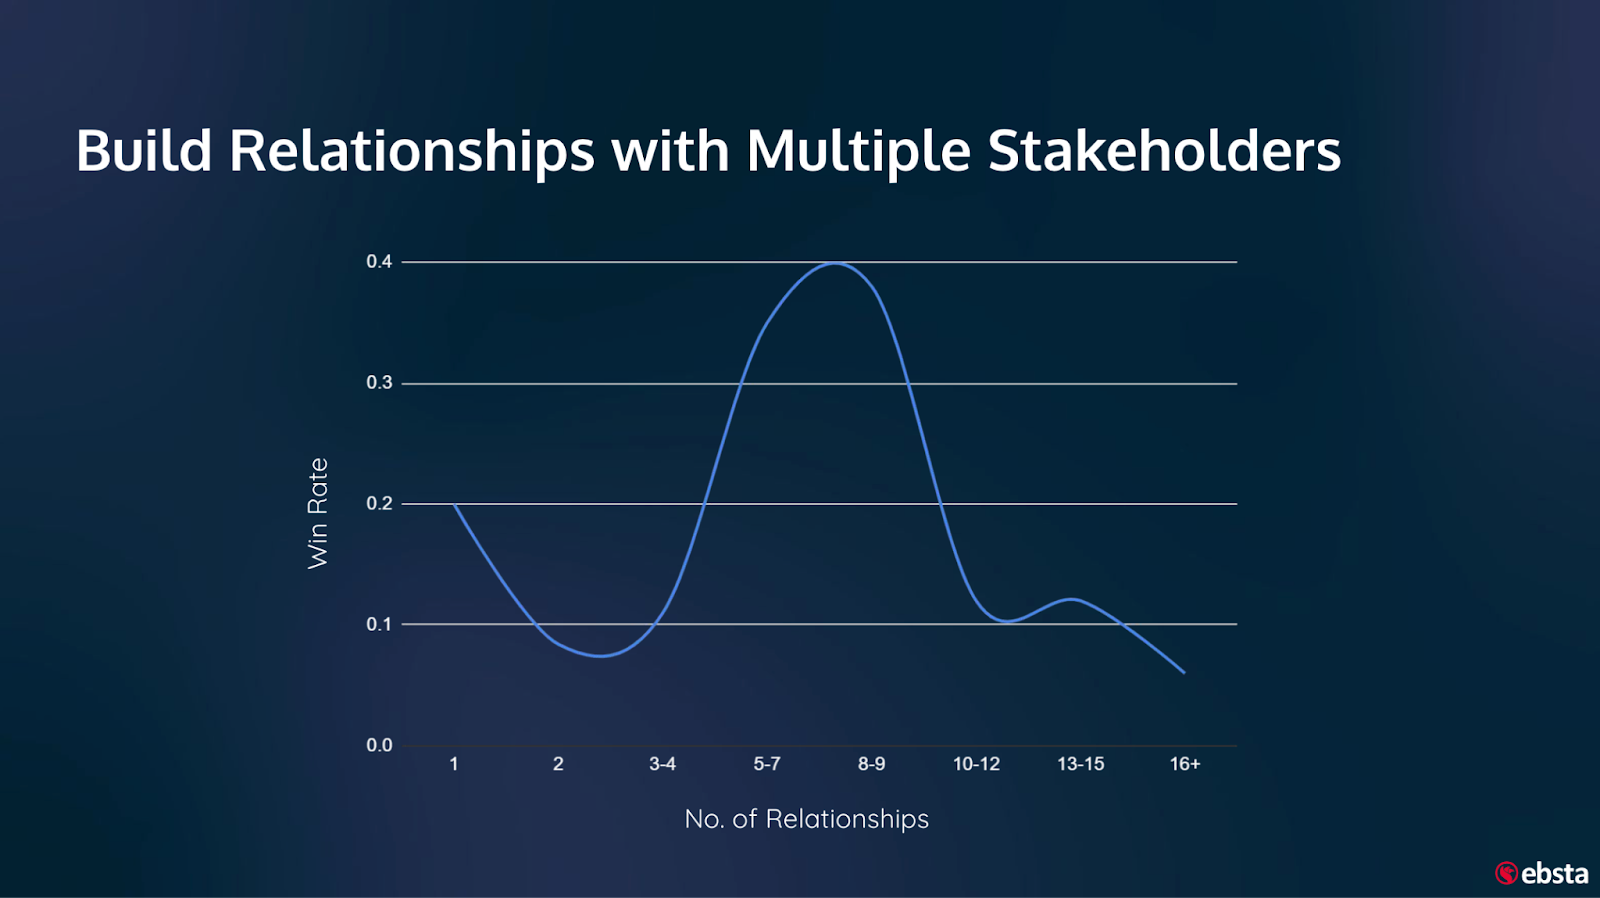
But actually, what we find is that there's a material impact on win rates when you start being more multi-threaded.
There's a word of caution here, because as you get over a certain line in the sand, the win rates plummet, because you end up with a decision by committee. More often than not, when you get down there, the conclusion is no change at all.
Engagement
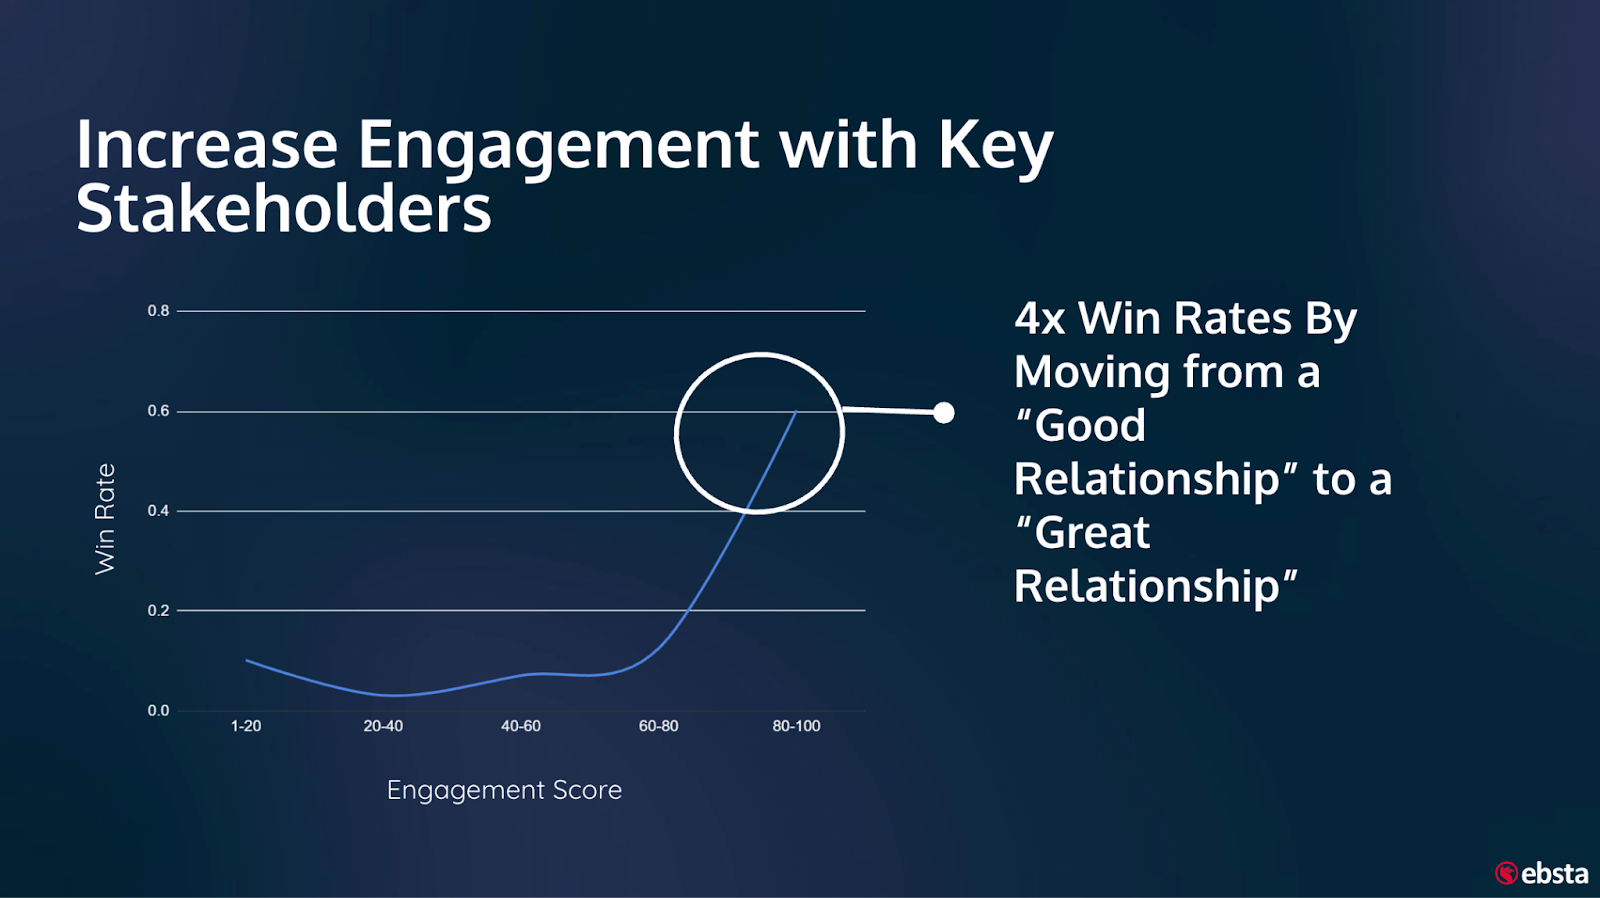
Our focus is very much on looking at the impact of relationships on revenue. To do that, what we needed was to codify what a relationship is. We give every relationship a customer has a score out of 100, and that engagement score trends up and down over time.
It's not unusual to find ourselves at the end of the sales process with a good level of engagement, around 60 to 80.
We've engaged with the customer, we've got them sign a contract, they must trust us to a point, so we're well engaged.
But what we see consistently is that the influence on win rates, from moving your levels of engagement from good to great is times four.
So when you're working that complex, multi-threaded, B2B sales process, and you're in a late stage - don't lean back, lean in.
Find ways of getting your C-suite involved, try and build that momentum even higher, because if you end up with a good level of engagement at the end of the sales process, compared to a great level of engagement, you're missing out on improving the win rate by four.
How do we measure engagement? It’s a good question.
We take on board a whole host of data points across your business. A meeting is more valuable than a call, which is more valuable than an email, and inbound activity is a lot more valuable than outbound activity.
We also look at the velocity of that activity. If you and I exchanged an email once a month, it's very different than if you're exchanging email once an hour.
We take the data from source, as we're interested in seeing the calls, the meetings, the emails, activities that are actually going on, rather than just what people are actually logging. Then we look at that data and try to look at the influence that data had historically on the deals you closed in the past to try and give some context.
You only need 50 reps working 20 opportunities a quarter to have 4000 deals a year going through your business.
If you're only closing 25% of that, that's 3000 deals closing lost, and understanding the momentum behind each deal and which personas you should be engaging with each stage. is information you've already got in your business, it's just in the wrong place.
Deal qualification
Getting yourself on that journey to becoming more data driven, getting access to the information benchmarking is key to this.
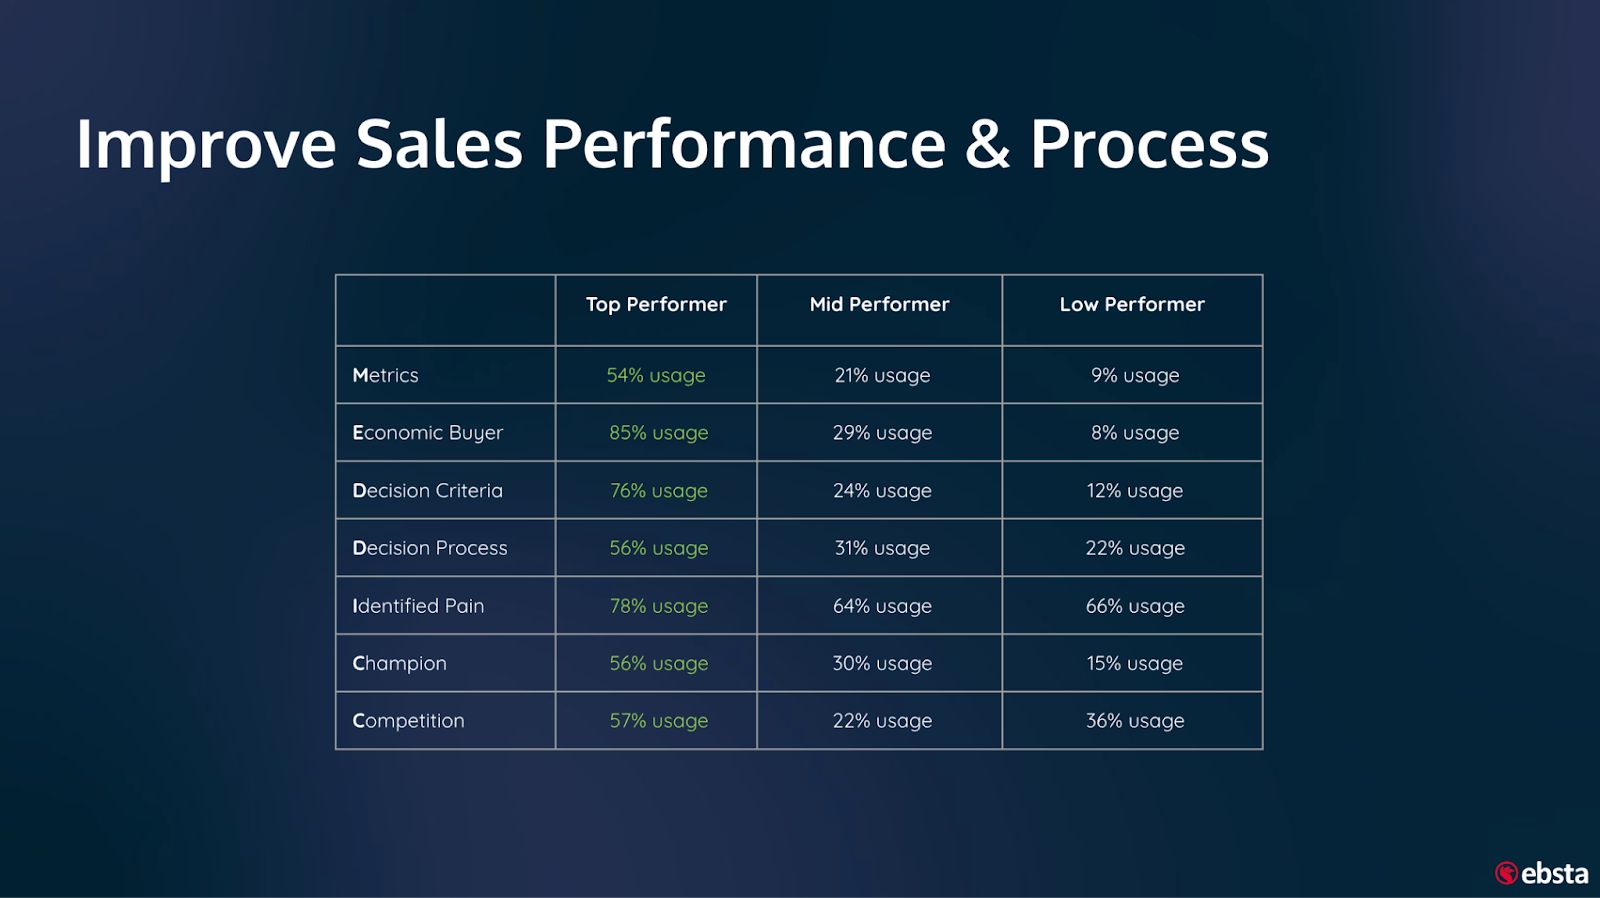
I really like the stat in the image above as well. This isn't necessarily about specifically looking at MEDDICC or any other qualification metric.
What this is about is looking at the behavior of your top performers. What are they doing that the others aren't?
That particular graphic is looking at the adoption of a qualification metric. No one adopts all of the elements of MEDDICC, for example, 100% of the time, but there are those that use it more.
There's also a world of difference between saying you're doing it and writing it in a pad, and actually having it recorded in your system of record. So we've got to make it easier for the reps on the ground by having all this information available and captured in the system of record inside Salesforce.
That way we don't need them going elsewhere anymore, they get everything in one place, and it makes it easy for them and helps them adopt.
You can see the impact on the graph - the top performers are always the ones using this qualification metric more.
Source
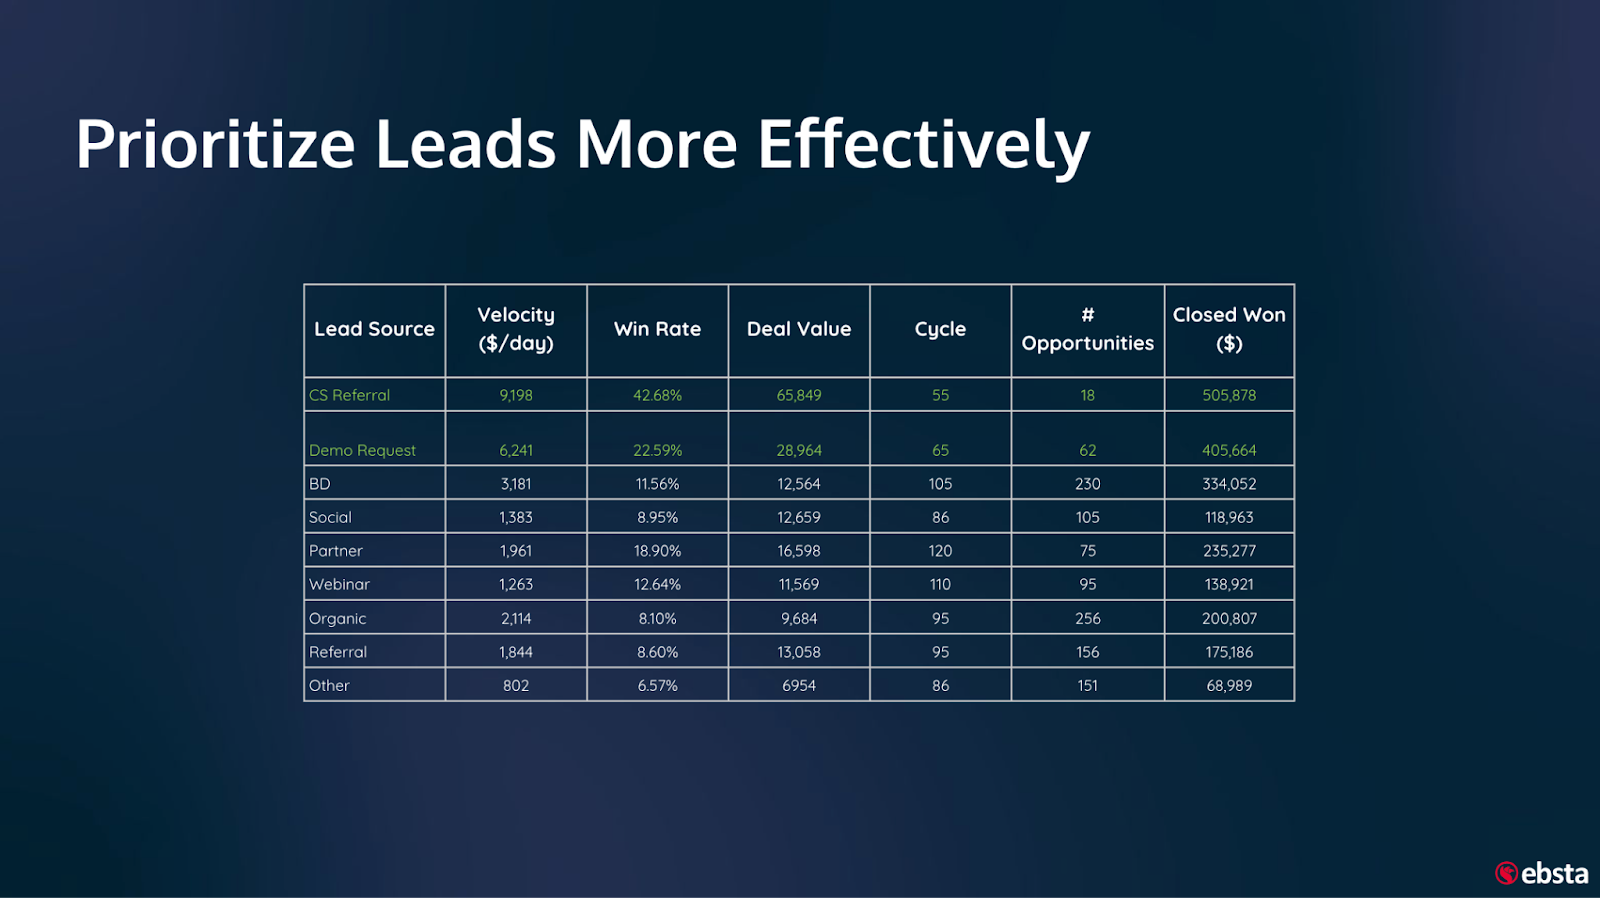
It’s the same with leads. The volume of leads doesn't equal quality and consistency.
The message here is that these graphics and these charts are useful to your team, just to get your message across.
Knowing that a specific source of data is going to give you a better conversion rate over another is something that you might know intrinsically, but the SDRs and AEs on the ground may not understand.
When you can show it to them graphically, they'll start to understand why you're insisting that they prioritize leads from a certain source over another.
Time
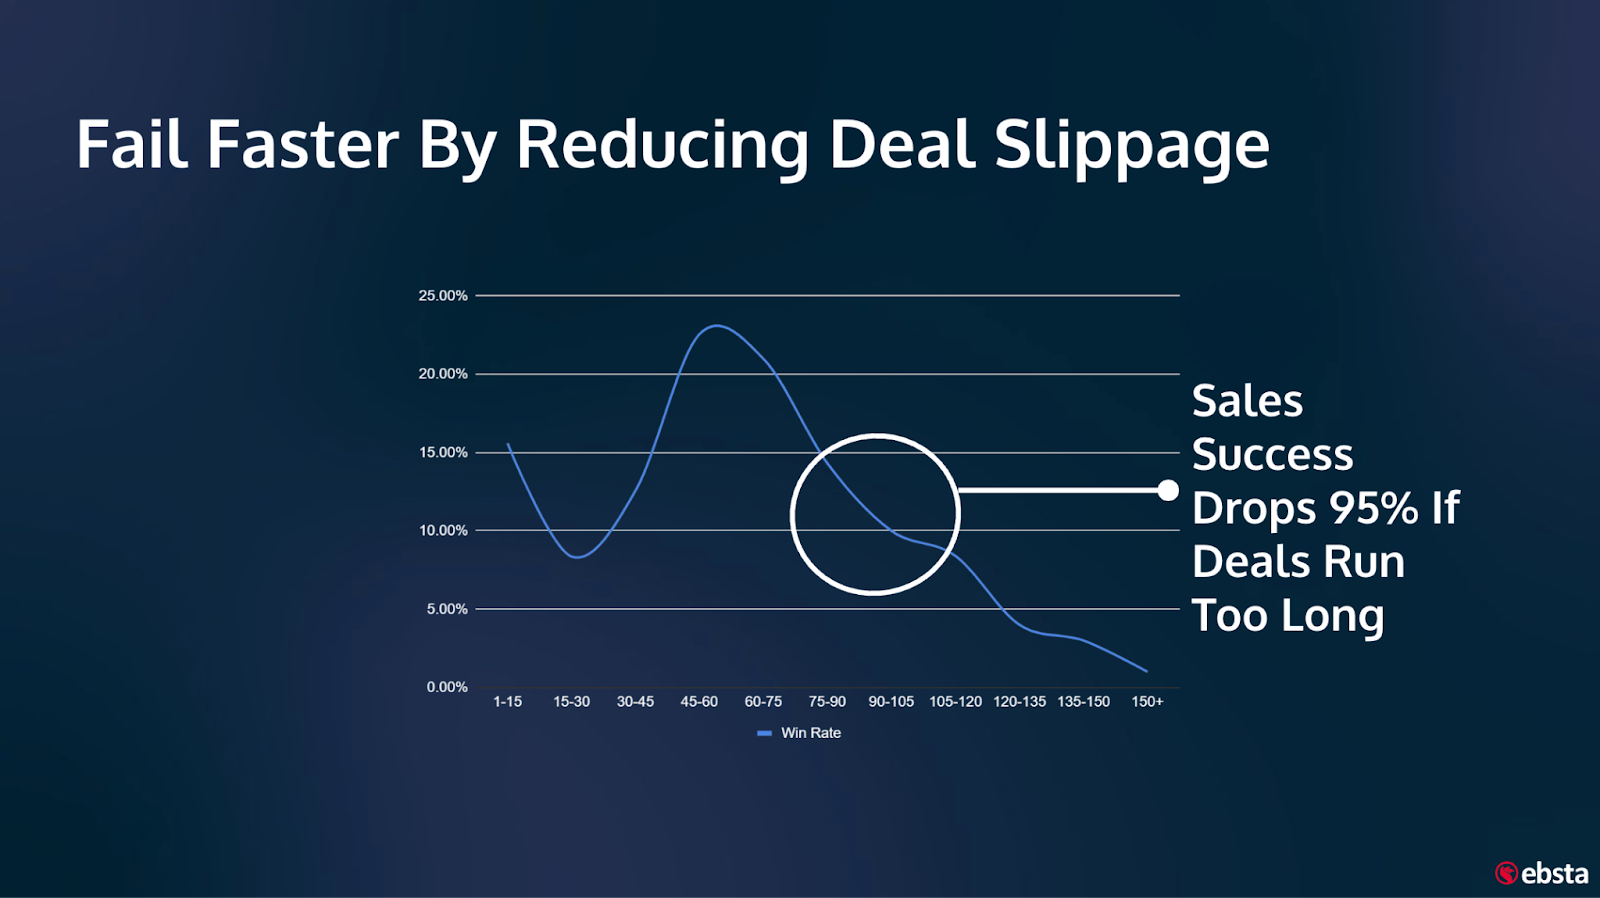
Finally, the key one here is that time kills all deals. We know this, and we also know that only 30% of opportunities open close won.
So at what point should we be closing the deals off as lost? How much slippage should we accept?
Once you've got this in graphical format, it stops becoming a battle with the AE, because suddenly they understand why you're telling them to close off as lost - it's only got a 3% chance of closing based on the 4000 deals we've analyzed.
As an AE, I now understand why you're suggesting I move on. Understanding the influence that time has on your deals is key to helping you get your AEs to move on.
I hope you found that insightful, thank you.